


Virality, Valuations, and Venture
How much does activity on social media contribute to VC success?


Venture capital and social media go together like Goldman Sachs and golf. Or so it seems. High visibility, brand management, consistent engagement, network effects, and scrupulous filtering mechanisms are necessary for the fruitfulness of both. When done properly, a virtuous cycle should result, in which effective leveraging of one should enhance performance of the other. That’s why so many prominent VCs boast active, polished, and professional profiles on LinkedIn, X (née Twitter), Instagram, and, to a lesser extent, TikTok. A cursory search of the top three VC firms on the Midas list on LinkedIn and X yields reams of content profiling their founders, industries of interest, and latest investments. But just how much does a VC firm’s interaction with social media drive its returns? Does engagement with certain type(s) of social media improve specific VC workflows, like deal flow or fundraising?
The short answer? No, we looked and didn’t see any correlation between posting frequency and returns. Sorry to disappoint: being loud doesn’t mean being rich.
The long answer? See below. (Disclaimer: please don’t refer to this as a statistical/econometric study with definitive answers. All we are trying to do is to identify some patterns and to tell a story with numbers).
(1) The majority of VC firms published under 20 posts per year, equivalent to two posts per month.

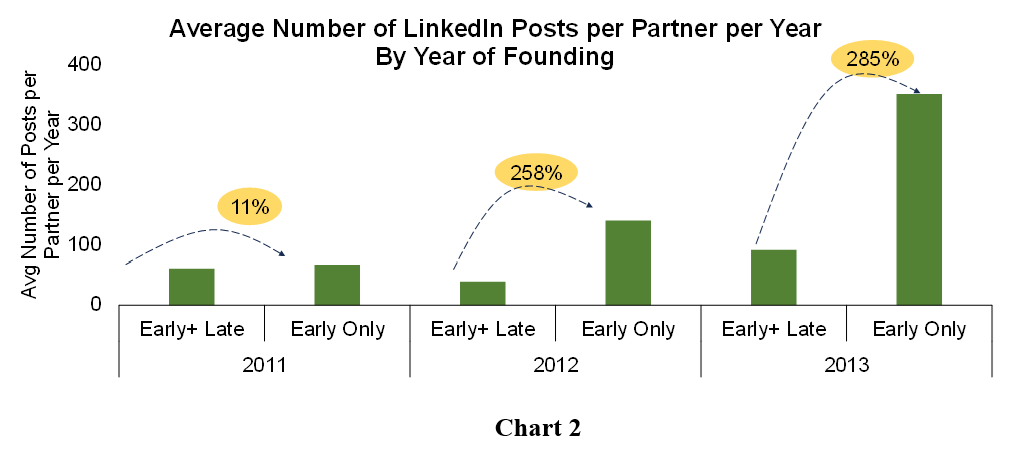
(2) Seed -stage-only investors try to hog more eyeballs than age-agnostic or later stage investors. Table 1 shows that the average number of LinkedIn posts per partner per year at firms who only invest in early-stage companies is double that of firms who invest across company lifecycles. Importantly, this ratio was observed even when accounting for the different times that VC leaders wrote their first posts on LinkedIn, as Chart 23 illustrates.[1] (To control for the variety in LinkedIn debuts, posts published until the first week of November 2023 were counted.) The gap in posting frequency between seed-stage and age-agnostic investors widened between 2011 and 2013. In 2011, seed-stage firms posted 11% more frequently than age-agnostic or later stage investors; in 2013, 285% more.

(3) New York and Bay Area VCs post like nobody’s watching. (The coastal elites love to be seen and heard.) Figure 1 shows that an average Silicon Valley VC partner posted 15 times on LinkedIn per year, slightly more times than a NY VC partner and three times as many as California-based VC partners outside the Bay Area. One caveat to note is that the highest number of posts throughout partners’ activity on LinkedIn is highest for VCs from areas like DC and Utah.[2]

(4) Post and pray! Industry-agnostic VCs post more than industry-specific ones. VC partners at firms interested in more than 10 industries are most active on LinkedIn.[3] Posting frequency from partners firms with unfocused investment interests was 20% higher than posting frequency from partners at firms interested in fewer than five industries, as Chart 3 shows. Interestingly, though single-industry VC firms post less frequently, they began posting on LinkedIn about a decade before their more active peers.

(5) The cheaper the check, the heavier the posting. As shown in Chart 4, Partners at VC firms who invested under $500,000 in portfolio companies post almost twice as much as do partners at VC who invested more than $500,000. Each of the bars in the chart below represents between 10 and 12 firms.

(6) Posting frequency does not correlate strongly with frequency of unicorn exits. Chart 5 shows that firms in which partners post a lot on LinkedIn don’t generate more unicorns as a percentage of the number of investments compared to firms where partners don’t. Partners of firms that invest in the highest percentage of companies that become unicorns, like Rally Ventures (5%) and Moonshot Capital (2%) post under 10 times per year. Partners from some firms without any unicorn exits posted 50+ times per year on LinkedIn, or weekly.

(7) Negative correlation is observed between posting frequency and the value of unicorn exits, as seen in Chart 6. Of note, firms that invested in the highest number unicorns aren't the same firms who enjoyed the highest unicorn valuations. No difference was observed in total valuations across unicorn exits between firms in which partners post frequently on LinkedIn and ones in which partners do not. The sum of the valuations of nine unicorns backed by Rally Ventures is 40% below the sum of valuations of nine unicorns backed by Slow Ventures. Both firms’ partners on average posted fewer than 10 posts per year, but Rally posted 170 times and Slow Ventures posted 70 times over since each firm has been on LinkedIn.

(8) Firms in which each partner posted under 10 times annually produced, on average, the most unicorns: 1 out of every 100 investments grew into a unicorn. Conversely, as illustrated in Chart 7, firms in which each partner posted more than 30 times per year on LinkedIn were half as successful. To control for the possibility that older firms are better at picking unicorns because of experience, the earliest founding year of firms in each group was examined. No substantial difference in how long these groups have been on the VC funding market was observed.

(9) Posting frequency positively correlates with the number of funds raised, as Chart 8 shows. Each SparkLabs partner on average has posted 67 times per year; the firm has raised 15 funds. Counterparts at Lightbank have posted twice per year; the firm has raised two funds. Data suggests the frequent posting activity facilitates fundraising, perhaps because posting builds firms’ reputations.

(10) High-volume posting means smaller check sizes. Posting frequency negatively correlates with fund size, as seen in Chart 9. Innovation Endeavors, for example, raised $600M in their largest fund, but each partner there on average posted fewer than 10 times per year on LinkedIn.

Note on the data selection and analysis methods:
Quantitative: Data from Pitchbook and LinkedIn were collected to determine whether the following correlations existed between: (1) frequency of posts by partners for VC firm and number of unicorn exits,[1] (2) volume of posts per partner at firm and valuation of unicorns created, (3) frequency of posts and max fund size ever raised, and (4) frequency of posts and quantity of funds raised.
To decide which VC firms merited analysis, Pitchbook was used to gather a list of North-America-based firms that have a track record of solid performance (at least 20 exits and two funds raised). (The likes of legends such as Seqouia were excluded because they were expected to be outliers that would skew analysis.) Search was industry agnostic, but funds had to be closed and specialize in seed through series B fundraising. Firms had to have been founded between 2008 and 2020.
38 firms and 139 partners who either work at or founded these firms were selected for further exploration. Partners are defined as GPs, Managing Directors, or other key decision makers in the investment team of a VC firm. Posts published by the 139 people were manually counted on LinkedIn, from date of first post until the first week of November 2023.
[1] We chose 2011 through 2013 as these years observed a sufficiently large sample size (i.e. not a size where we would have to compare one single firm with another).
[2] The state here is defined as the headquarter state of the VC firm, not the state of residence of the VC partners.
[3] Pitchbook’s “preferred industry indicators” filter displays the number of industries each VC firm follows, which was taken as a proxy for how many verticals these firms invested in.
 | A guest post by
|